Background in Coating and Corrosion Industry
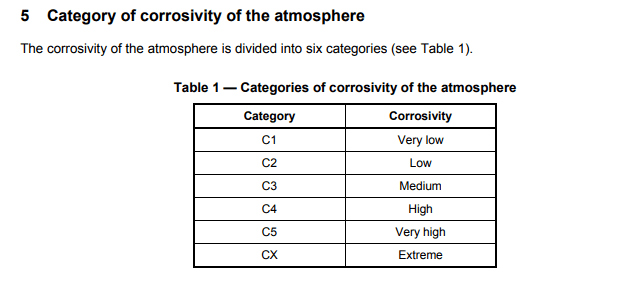
Anyone working in the outdoor corrosion or coatings business should be familiar with the ISO standards of ISO12944-2 and its pair standard ISO9223. The first provides guidance for coating selection given specific environmental conditions and the latter standard offers guidance for how to actually compute those atmospheric conditions. Consider the table below from ISO9223; everything falls into a "C1 through CX" environmental classification. Generally, C1 environments are indoors (or some very very dry areas of Earth, such as Mongolia)
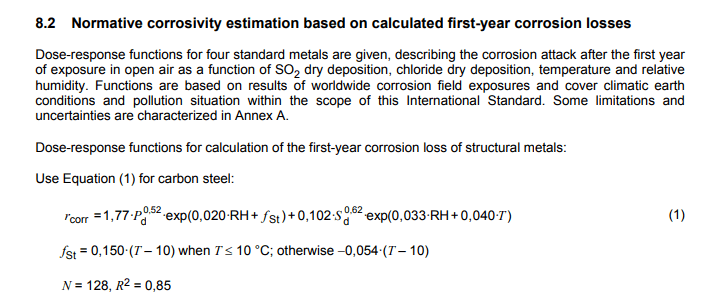
These classifications come from a "dose response" function in ISO9223. Below is the one for steel. Essentially, if you know a handful of things about the environment (T = Temperature, RH = Relative Humidity, S_d = Chlorides, P_d = Sulfates) and get them into the right units, you can estimate the corrosivity of the local environment. There's a long story on the creation of these functions, which is a story for another day but the reader is encouraged to buy the ISOCORRAG book. It's my bedside reading!
If you ask anyone in the coatings or corrosion prevention industry what the ISO9223/ISO12944-2 environmental conditions are for a given facility, they might have a general answer but rarely know the environmental condition. Why? Getting all the data required to calculate this response function is harder than one might think.
Introducing our ISO9223 Global Map
We've been working on ISO9223 Atmospheric maps for almost five years now, starting in a paper we published in NACE 2019. Initially, we had pretty limited data sources; some good temperature and humidity data, good SO2 deposition data from the EPA but very limited chloride deposition data. Particularly, we had almost no chloride deposition data collected via the "notorious" ISO9225 Wet Candle Method (a subject for a future blog) besides a few of the volatile data points from the fantastic ISOCORRAG publication.
In the last year, however, we were able to build our own models to estimate chloride deposition data using a combination of wind speed, wind direction, elevation, and ambient chlorides. There is a growing body of literature in environmental science for estimating deposition on surfaces (the science is usually interested in plant surfaces). We were able to use some of this math to generate our own chloride deposition estimates. This validation process will be the subject of it's own future blog (or publication). We compared the results with the field data collected from ISOCORRAG and MICAT and found ourselves happy with the results.
The final result is the below image. It's also an actual wall map too. We can send you one for free, if you contact us!
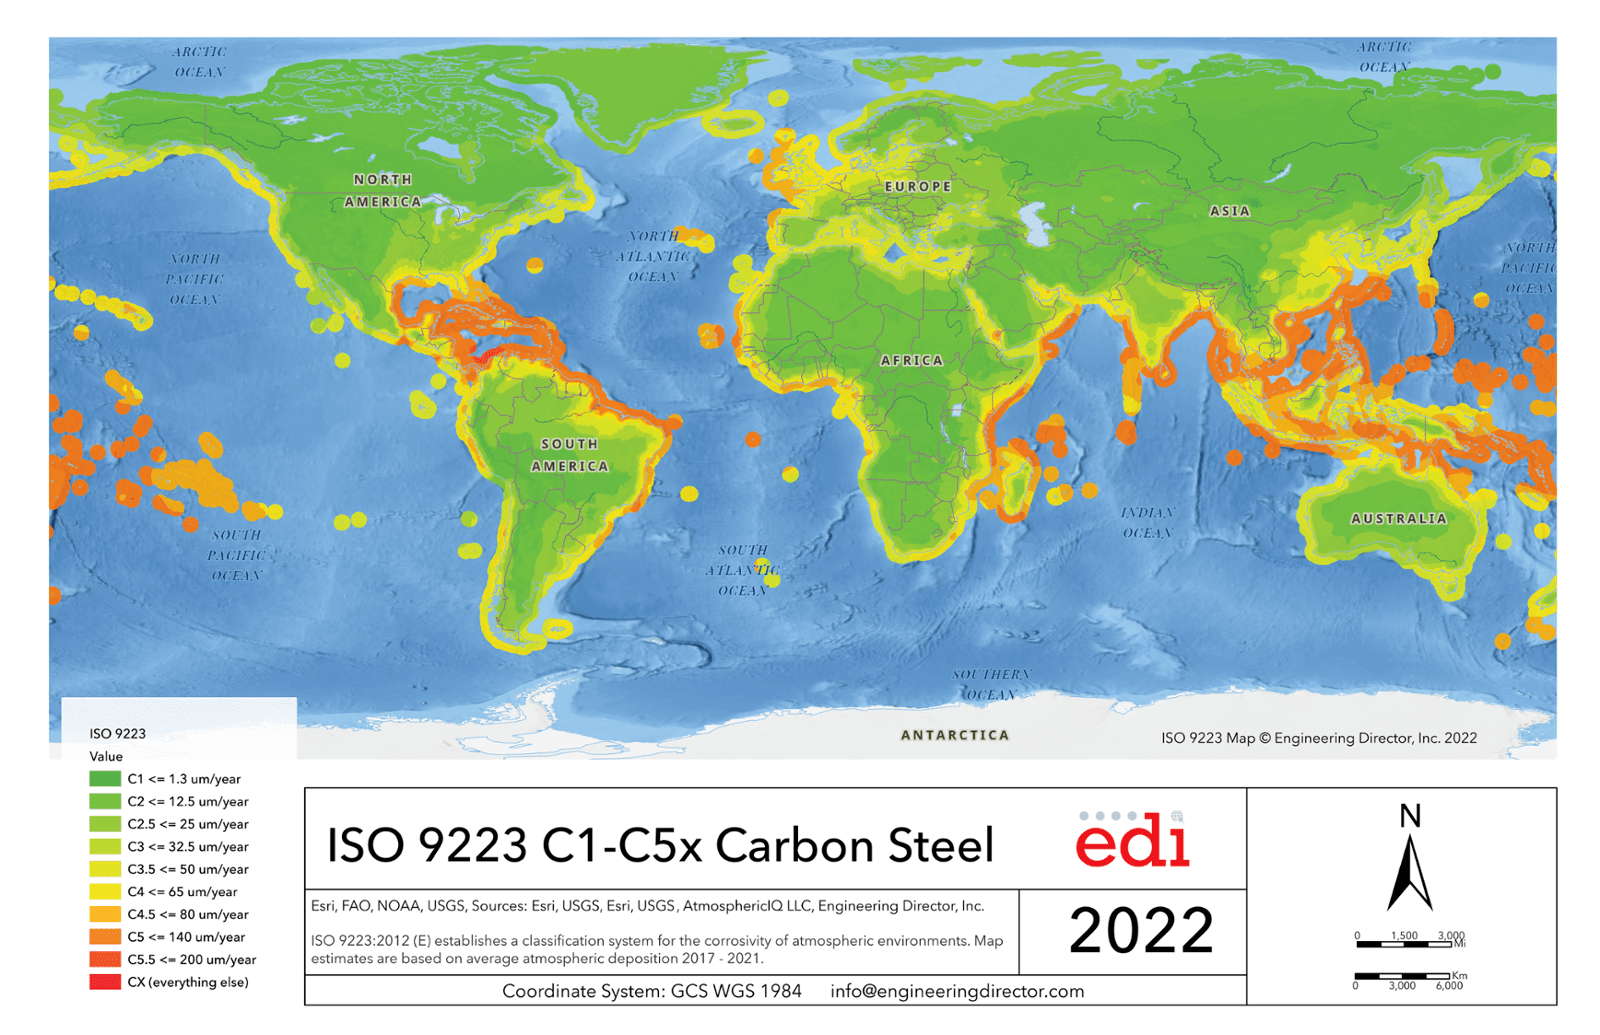
You can evaluate the algorithm yourself by clicking the button below to "Score your Facilities" - throw in an address or a latitude or longitude and we'll return to you the atmospheric corrosivity for that location.
Changes in Last 30 Years
One major change in environmental conditions since the creation of ISO9223 has been the dramatic decrease in ambient sulfates in North America. This effect is primarily driven by the decommissioning of coal-fired power generation. In addition, the few remaining coal-fired plants usually use scrubbers or other types of filters to reduce atmospheric contamination. Consider the chart below for Chicago, Illinois.
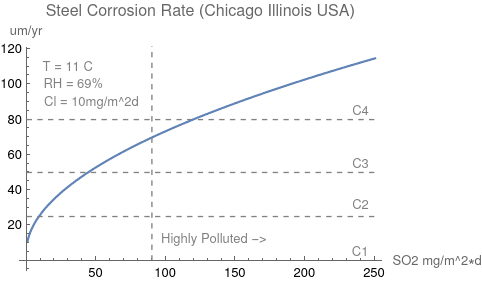
Chicago was once a quite polluted place, just look at some of the old buildings here still covered in soot. But as SO2 pollution has decreased (for a multitude of reasons here) the local ISO9223 environment has gone from a C4 to a C3 and likely will fall to a C2 environment as more local sulfate sources are removed. For further evidence, check out this animated GIF of sulfate ion concentrations from the EPA from the 1980s to the present. Sometimes, it seems rare to read good news when it comes to human-sourced emissions into the atmosphere, but this has been a major win for the environment and human life in North America. The "Acid Rain" era of the 1970s and 1980s is behind us. Source on the image below (EPA NTN).
Climate change presents a new set of challenges, the underlying variables in ISO9223 going to change, such as mean temperature and relative humidity. It's debatable whether the response functions of ISO9223 themselves are still sufficient under a new climate regime than when they were created. If you're aware of active research in this field, we'd love to be involved. Drop us an email on our contact page or find Tom Hayden on LinkedIn.
Excessive Localized Emissions (ELE)
There are still cases where our model may not be a good fit, in cases of excessive localized emission (ELE). Usually, ELE environments are highly industrialized or urban environments with a proximate major source of SO2 or Chloride contamination. For instance, a location next door to older coal-fired power plant may experience dramatically increased sulfate deposition. Another example (which we've seen in industry) might the presence of bird dung or other non-ambient sources of Chlorine contamination.
Data Sources
We think it's important to document and cite all the different data sources that went into the construction of our atmospheric corrosivity map. We're always interested in hearing about alternative sources of SO2 and Chloride data, so if you know any feel free to Contact Us!
Global Wind Atlas (v3) These are high resolution (250m) wind speed maps. These are probably the best wind maps we've seen published, especially if primarily interested in wind speed. These maps were integral for us in computing the wet and dry deposition rates. NOAA Integrated Surface Hourly - We use this dataset to build all our temperature and humidity maps. We run a github repository for processing the vast data from here and encourage anyone interested to check it out. EPA's National Atmospheric Deposition Program - The EPA collects fascinating "wet deposition" data using a very intensive laboratory process with buckets at over 150 field sites, processes the rainfall and provides the best deposition data available. NASA's Giovanni Tool - This is a great tool for finding scientific datasets published by NASA NASA MERRA-2 Re-Analysis Program - NASA published some great dataset relating to atmospheric chlorides and sulfates. Linked is one of their SO2 datasets. The MERRA-2 FAQs are especially useful for understanding the data. Swerea (Sweden) has done some good work aggregating historic ISOCORRAG/MICAT data, which we've been able to use for validation.
This article was written by Tom Hayden, our lead scientist and CTO. Reach out to him via email thayden@engineeringdirector.com or find him on Linkedin. He is always interested in talking about this stuff, so don't hesitate to send him your thoughts (good or bad!)